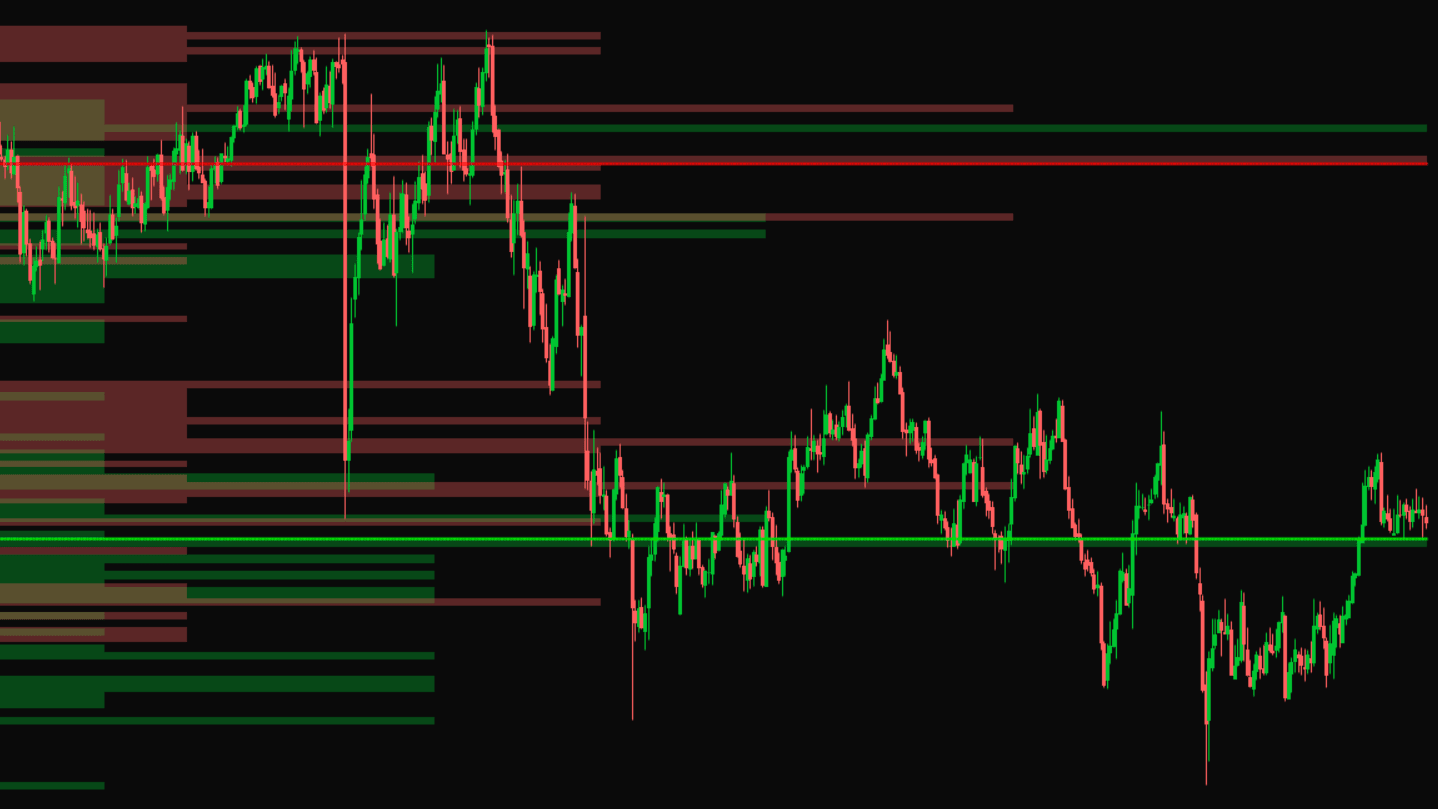
This TOS indicator is based on the idea that the more often the price hits a support or resistance level, the stronger that level becomes. This indicator plots a horizontal histogram at different levels on the price chart. The longer a histogram bar is, the more often that level has acted as support and resistance in the past.
This indicator can be customized to either show support and resistance separately, or to combine them both into one histogram. In addition, you can choose how often the profile resets, by either using all the data on the chart, or by having it reset daily, weekly, monthly, quarterly, or yearly. You can also choose whether to show the histogram in the expansion area on the right of the chart, or to overlay it over the price data.
Support & Resistance Profile
By purchasing this product, you acknowledge that you have read, understand, and agree without modification to the Terms & Conditions and Privacy Policy.
Because these are digital files, all sales are final. Returns, exchanges, and cancellations will not be accepted.

