
If you trade earnings, you need these tools for thinkorswim. This is a bundle of two TOS indicators, a scanner, and a watchlist column.
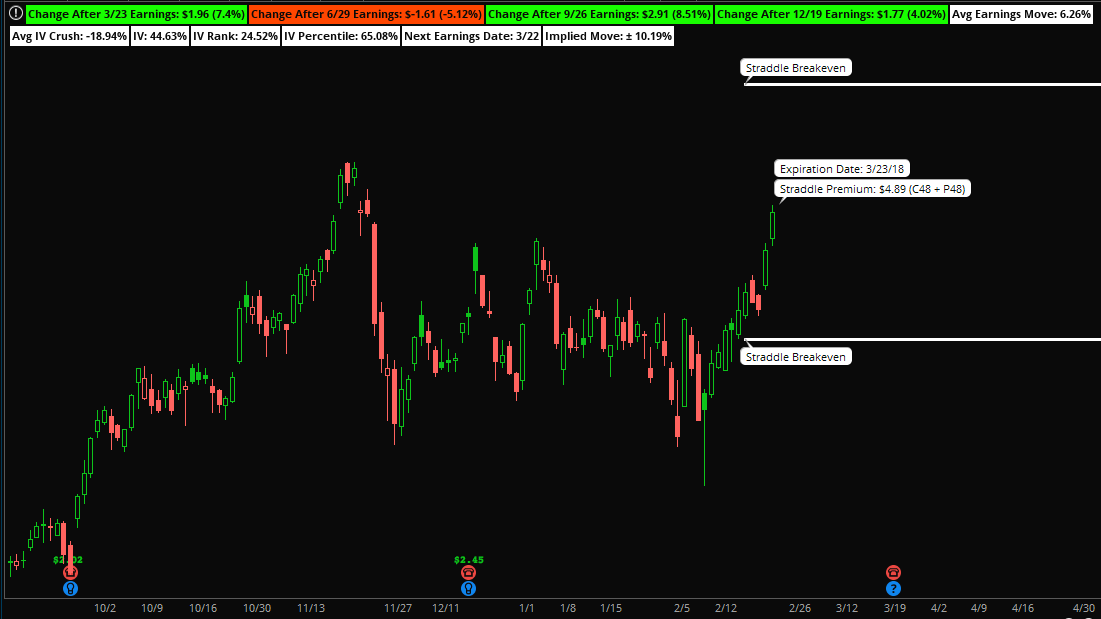
The Straddle indicator calculates the cost of a straddle options strategy (or strangle, if you choose), and displays the breakeven prices of the strategy on the chart. It also calculates the implied move that is priced into the options for the selected expiration date. You can choose the expiration date of the options, including weeklies. For straddles, it automatically picks the at-the-money strike price. For strangles, it automatically picks the closest out-of-the-money strikes.
The Earnings indicator displays important information about past earnings and the next upcoming earnings release. It tells you the price changes and percentage changes after the last eight earnings releases, as well as the average move and average implied volatility crush for the last four earnings releases, so you can quickly see a stock's historical earnings behavior. It also displays information about the stock's implied volatility, such as the IV rank and IV percentile. Finally, it tells you when the next earnings release will be, how many days until then, and whether it will be before or after market.
The scanner searches for stocks that have upcoming earnings. There is also a watchlist column that shows the average percentage move after the last four earnings releases, so you can sort stocks by how volatile they have been in the past.
Click here for more information on how to use these tools.
Earnings Scanner & Straddle Indicator
By purchasing this product, you acknowledge that you have read, understand, and agree without modification to the Terms & Conditions and Privacy Policy.
Because these are digital files, all sales are final. Returns, exchanges, and cancellations will not be accepted.